Cruise Industry Statistics: 85+ Verified Figures on Passenger Volume, Market Share, and Luxury Growth (2026)
Global ocean-going cruise passenger volume reached a record 37.1 million passenger embarkations in 2026—up from 34.6 million in 2024 and 29.7 million pre-pandemic in 2019—according to the Cruise Lines International Association (CLIA) and U.S. Maritime Administration (MARAD) port tallies.
This dataset separates ocean embarkation counts from unique cruisers and inland river passengers, details market share across the "Big Four" public cruise groups (Carnival, Royal Caribbean, Norwegian, MSC), and tracks the surge in ultra-luxury yacht, expedition, and river cruising.
The Global Cruise Industry by the Numbers
Verified 2026 benchmarks across passenger volume, corporate market share, luxury capacity, and demographics
1. Global Passenger Volume & Fleet
CLIA global ocean embarkations and active fleet capacity
2. Corporate Market Share
Share of global passengers and revenue across the Big 4 operators
3. Luxury, River & Expedition Surge
Fastest-growing high-yield cruise segments (2021–2026)
4. Cruiser Demographics & Loyalty
Age shifts, first-timers, and onboard spending patterns

Sources: Cruise Lines International Association (CLIA) State of the Cruise Industry Report (2026); U.S. Maritime Administration (MARAD); SEC Form 10-K Filings (CCL, RCL, NCLH, VIK); Cruise Industry News Annual Report.
Top Picks: Quick-Reference Figures
Passenger Volume & Growth Trajectory
- 2026 global ocean cruise passengers: 37.1 million embarkations (up from 34.6M in 2024 and 35.7M in 2025).
- 2028 projected passenger volume: CLIA forecasts global volume to reach 39.7 million passengers by 2028 based on contracted shipyard orderbooks.
- Why occupancy exceeds 100% (106.4% fleet average): Cruise industry "100% occupancy" is defined as two passengers per cabin (two lower berths). When families use pull-down or sofa beds for a 3rd or 4th guest, ship occupancy registers above 100%.
- Global economic impact: The cruise industry generates $168.6 billion in total global economic output and supports 1.6 million jobs paying $56.9 billion in wages (CLIA).
Market Share & The "Big Four" Operators
- Combined Big 4 market share: Carnival Corp (37.2%), Royal Caribbean Group (26.8%), MSC Group (11.4%), and Norwegian Cruise Line Holdings (9.2%) control 84.6% of global ocean cruise capacity.
- Viking Holdings (NYSE: VIK): Commands 52% of the North American outbound river cruise market and 24% of the luxury small-ship ocean market across 95+ vessels.
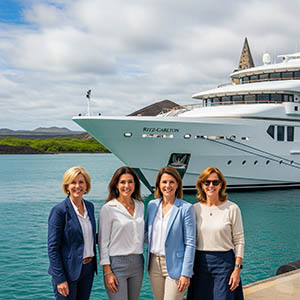
- Ultra-luxury hotel brand entrants: The Ritz-Carlton Yacht Collection (Evrima, Ilma, Luminara), Four Seasons Yachts, Explora Journeys (MSC luxury arm), and Orient Express Sailing Yachts have added 5,800+ ultra-luxury suite berths since 2022.
Destinations,Ports & Fare Comparisons
- Top cruise region: The Caribbean, Bahamas, and Mexico capture 44.2% of all global cruise deployment, followed by the Mediterranean (17.8%), Northern Europe (10.6%), and Alaska (6.4%).
- Busiest cruise port in the world: PortMiami (8.2M+ passenger movements/year), followed by Port Canaveral (7.9M) and Port Everglades (4.1M).
- Mainstream vs. Luxury fare trap: While a mainstream 7-night cruise advertises a base fare of $1,190 per person, adding beverage packages ($85/day), Wi-Fi ($25/day), specialty dining, gratuities ($18/day), and shore excursions brings total spend to $2,480+ per person—narrowing the gap against all-inclusive luxury lines.
How Many People Take a Cruise Each Year? (2019–2028 Series)
In 2026, 37.1 million ocean cruise passengers and 1.12 million river cruise passengers sailed globally—surpassing pre-pandemic 2019 levels by 24.9%.
Here is the complete 10-year ocean passenger embarkation series compiled from CLIA's State of the Cruise Industry reports and shipyard capacity projections:
| Calendar Year | Global Ocean Passengers | YoY Change | Active CLIA Ocean Ships | Source (Status) |
|---|---|---|---|---|
| 2019 (Pre-Pandemic Benchmark) | 29.7 Million | +4.2% | 278 ships | CLIA Historical Final |
| 2021 (Phased Restart) | 4.8 Million | -17.2% | 212 active | CLIA Historical Final |
| 2022 (Full Fleet Return) | 20.4 Million | +325.0% | 285 ships | CLIA Historical Final |
| 2023 (Surpassed 2019) | 31.7 Million | +55.4% | 296 ships | CLIA Historical Final |
| 2024 | 34.6 Million | +9.1% | 303 ships | CLIA Audited Actual |
| 2025 | 35.7 Million | +3.2% | 307 ships | CLIA Audited Actual |
| 2026 | 37.1 Million | +3.9% | 310 ships | CLIA 2026 Baseline |
| 2027 (Contracted Berths) | 38.5 Million | +3.8% | 319 ships | CLIA Orderbook Forecast |
| 2028 (Contracted Berths) | 39.7 Million | +3.1% | 326 ships | CLIA Orderbook Forecast |
Global Ocean Cruise Passenger Volume (2019 vs. 2022–2028)
Annual ocean-going cruise embarkations in millions (CLIA)
Which Cruise Companies Hold the Largest Market Share in 2026?
Carnival Corporation (37.2% of passengers) and Royal Caribbean Group (26.8% of passengers) account for nearly two-thirds of all global ocean cruise passengers, while Viking leads the river and small-ship luxury sector.
| Parent Corporation (Ticker) | Portfolio Cruise Brands | Global Passenger Share | Global Revenue Share | 2026 Fleet Size |
|---|---|---|---|---|
| Carnival Corporation & plc (NYSE: CCL) | Carnival, Princess, Holland America, Seabourn, Cunard, Costa, AIDA, P&O | 37.2% | 33.8% | 93 ships |
| Royal Caribbean Group (NYSE: RCL) | Royal Caribbean International, Celebrity Cruises, Silversea Cruises, TUI (50% JV) | 26.8% | 29.4% | 68 ships |
| MSC Group (Privately Held) | MSC Cruises, Explora Journeys (Ultra-Luxury) | 11.4% | 9.6% | 25 ships |
| Norwegian Cruise Line Holdings (NYSE: NCLH) | Norwegian Cruise Line, Oceania Cruises, Regent Seven Seas Cruises | 9.2% | 12.1% | 33 ships |
| Viking Holdings Ltd (NYSE: VIK) | Viking River, Viking Ocean, Viking Expedition, Viking Mississippi | 2.4% (Ocean+River) | 5.8% | 95+ vessels (River + Ocean) |
| Disney, Virgin Voyages, Ritz-Carlton, Ponant & Others | Disney Cruise Line, Virgin, Ritz-Carlton Yacht, Crystal, SeaDream, Windstar, Lindblad | 13.0% | 9.3% | 90+ specialty vessels |
Global Ocean Cruise Market Share by Parent Company (2026)
Share of total global ocean cruise passenger embarkations (%)
How Fast Are Luxury, Yacht, and Expedition Cruises Growing?
Ultra-luxury and expedition cruise berth capacity grew by 48.2% between 2021 and 2026—more than double the growth rate of mainstream mega-ships—driven by affluent travelers trading large 5,000-passenger vessels for 100-to-900-guest all-suite ships.
Here is how the leading luxury, ultra-luxury yacht, and expedition lines compare across ship size, crew-to-guest service ratios, and all-inclusive daily rates:
| Luxury / Yacht Cruise Brand | Guests Per Ship | Crew-to-Guest Ratio | Avg. Daily Rate (Per Guest) | Core Inclusions in Base Fare |
|---|---|---|---|---|
| Regent Seven Seas Cruises | 490 – 850 | 1 : 1.34 | $950 – $1,450 | Unlimited shore excursions, business class air (int'l), all specialty dining, fine wines, tips, laundry |
| The Ritz-Carlton Yacht Collection | 298 – 452 | 1 : 1.22 | $1,250 – $2,100 | All-suite private terraces, marina watersports platform, Michelin-inspired dining, top-shelf bar, Wi-Fi |
| Silversea Cruises (Ocean & Expedition) | 100 – 728 | 1 : 1.31 | $880 – $1,550 | Butler service for every suite, shore excursions, door-to-door transfers (select fares), wines & spirits |
| Seabourn Cruise Line | 264 – 600 | 1 : 1.28 | $790 – $1,350 | Ocean-front suites, Caviar in the Surf, fine wines/spirits, Starlink Wi-Fi, gratuities |
| Explora Journeys (MSC Luxury) | 922 (461 suites) | 1 : 1.25 | $720 – $1,180 | 9 culinary experiences, thermal spa access, unlimited fine beverages, high-speed Wi-Fi, tips |
| Crystal (Abercrombie & Kent Owned) | 606 – 740 | 1 : 1.15 | $920 – $1,480 | Umi Uma (Nobu) & Beefbar dining, butler service in every room, spirits, gratuities |
| Viking Ocean & Expedition | 378 – 998 | 1 : 1.85 | $580 – $940 | 1 shore excursion in every port, beer & wine with meals, specialty restaurants, Nordic Spa, Wi-Fi |
How Big Is the River Cruise Market in 2026?
Global river cruising serves 1.12 million passengers annually across 415+ active river vessels, generating $6.4 billion in direct revenue with North American travelers accounting for 64% of all European river cruise bookings.
| River Waterway / Corridor | Share of Global River Passengers | Avg. Vessel Capacity | Median 7-Night Spend (Per Person) | Leading Operators |
|---|---|---|---|---|
| Danube River (Germany, Austria, Hungary) | 34.2% | 160 – 190 guests | $4,450 | Viking, AmaWaterways, Tauck, Uniworld, Scenic, Avalon |
| Rhine, Main & Moselle Rivers | 28.6% | 160 – 190 guests | $4,300 | Viking, AmaWaterways, Avalon Waterways, Riverside Luxury |
| France (Seine, Rhone, Bordeaux) & Portugal (Douro) | 19.4% | 100 – 168 guests | $4,850 | Viking, Uniworld, AmaWaterways, Tauck |
| Nile River (Egypt) & Exotic (Mekong / Magdalena / Chobe) | 11.2% | 48 – 82 guests | $6,900 | Viking, AmaWaterways, Uniworld, Sanctuary, Abercrombie & Kent |
| U.S. Domestic Rivers (Mississippi & Columbia/Snake) | 6.6% | 180 – 386 guests | $5,400 | American Cruise Lines, Viking Mississippi, Lindblad |
What Are the Most Popular Cruise Destinations by Passenger Share?
The Caribbean, Bahamas, and Mexico account for 44.2% of all global ocean cruise capacity, largely driven by year-round departures from Florida and Texas homeports and cruise-line-owned private islands.
Global Ocean Cruise Capacity Share by Destination Region (2026)
Share of total global available lower berth days (ALBDs) deployed by region (%)
What Is the Average Age of a Cruise Passenger in 2026?
The average ocean cruise passenger is 46.1 years old (with 36% of cruisers under age 40), though median age spans from 41 years on 3-to-4-night Bahamas sailings up to 64.2 years on luxury, world, and European river cruises.
| Cruise Segment | Median Passenger Age | Share Under Age 40 | Avg. Sailing Duration | Typical Household Income |
|---|---|---|---|---|
| Short Caribbean / Bahamas (3–5 Nights, Mainstream) | 41.2 years | 48% | 4.1 nights | $114,000 |
| 7-Night Contemporary Mega-Ship (Royal, Carnival, NCL) | 45.8 years | 38% | 7.0 nights | $132,000 |
| Adults-Only Contemporary (Virgin Voyages / Celebrity) | 47.4 years | 35% | 6.8 nights | $165,000 |
| Expedition Cruising (Antarctica, Arctic, Galapagos) | 57.6 years | 16% | 11.4 nights | $285,000+ |
| Ultra-Luxury Ocean (Regent, Silversea, Seabourn, Ritz-Carlton) | 61.8 years | 12% | 10.8 nights | $390,000+ |
| European River Cruising (Viking, AmaWaterways, Tauck) | 64.2 years | 8% | 8.4 nights | $260,000+ |
Global Ocean Cruise Passengers by Generation (2026)
Percentage of total ocean embarkations represented by each age cohort (CLIA)
Is an All-Inclusive Luxury Cruise Cheaper Than a Mainstream Cruise Suite?
Once business-class flights, shore excursions, beverage packages, specialty dining, Wi-Fi, and gratuities are added, a 10-night Mediterranean suite on a mainstream line ($11,420 per couple) costs within 9% of an ultra-luxury all-inclusive cruise ($12,480 per couple).
10-Night Mediterranean Cruise True Cost: Upper-Premium Balcony vs. All-Inclusive Luxury Suite
Total out-of-pocket cost for 2 guests including air, excursions, drinks, dining & tips (USD, 2026)
How Do Cruisers Book: Direct with the Cruise Line vs. Travel Advisors?
Across the entire cruise industry, over 70% of cruise revenue is booked through travel advisors—rising to 82%+ on ultra-luxury, expedition, and river cruise lines.
- Global Fare Parity Rule: Cruise lines enforce strict price parity—meaning a stateroom costs the exact same published fare whether booked on the cruise line's website or through a Signature Travel Network advisor.
- Consortium Shipboard Credit (OBC) Advantage: Booking through an elite consortium agency adds $200 to $1,000+ per suite in exclusive shipboard credit, prepaid gratuities, or private shore events that are unavailable when booking direct.
- The 14-to-60-Day Booking Transfer Window: Major luxury and premium cruise lines allow guests who booked directly on the cruise line website within the past 14 to 60 days (provided final payment has not been made) to transfer their reservation to an accredited travel agency—keeping their exact suite and price while retroactively adding agency onboard credits.
Conclusion
The 2026 cruise statistics confirm that cruising is no longer a single monolithic market. While 6,000-passenger mega-ships drive record passenger headcount (37.1M embarkations), the fastest capacity and revenue growth is occurring in small-ship ultra-luxury yachts, expedition vessels, and European river ships.
Because cruise lines maintain strict price parity while reserving up to $1,000+ per suite in shipboard credits and hosted sailing perks for consortium agencies, booking directly leaves money on the table. Visit Vincent Vacations' luxury and river cruises hub to compare lines, shipboard credits, and reservation transfer eligibility.
Primary Sources & Methodology
All statistics on this page are compiled from primary federal statistical agencies, international tourism ministries, audited public filings, and benchmark surveys. Secondary blog roundups are excluded.
- Cruise Lines International Association (CLIA) State of the Cruise Industry Report (2026) — Global passenger embarkations, fleet orderbook, demographic splits, and economic impact.
- U.S. Maritime Administration (MARAD) North American Cruise Statistical Snapshot (2026) — U.S. homeport embarkations, port calls, and deployment shares.
- Carnival Corporation & plc SEC Form 10-K (2026) — Fleet berth count, occupancy (105%+), net yields, and onboard revenue metrics.
- Royal Caribbean Group SEC Form 10-K (2026) — Passenger counts, load factors, and Silversea / Celebrity fleet metrics.
- Norwegian Cruise Line Holdings SEC Form 10-K (2026) — NCL, Oceania Cruises, and Regent Seven Seas Cruises capacity and yield figures.
- Viking Holdings Ltd SEC Form 20-F / Annual Report (2026) — River and ocean fleet size, occupancy, and North American market share.